Add a Curriculum Bundle to Your Account!
Please select a bundle.


The Pack contains associated resources for the learning experience, typically in the form of articles and videos. There is a teacher Pack (with only teacher information) and a student Pack (which contains only student information). As a teacher, you can toggle between both to see everything.
Here are the teacher pack items for Shifting Demographics:


Overview In this experience, students make observations about the Nighttime Map of U.S. population distribution. Then they describe the U.S. population density from 1790 to 2010 based on an animated map. Next they use an interactive demographic map to answer questions about the U.S. population in 2020. Then they use another interactive demographic map to explore a demographic topic of their own choosing. Finally they learn about the purpose of the U.S. census and create a poster encouraging people to respond to the census questionnaire. Estimated duration: 45-60 minutes, depending on how much time you allot for students to explore the interactive maps Discovery Reading A printable Discovery Reading is included in the student pack as a support for understanding the experience’s core content and concepts. This Discovery Reading is not necessary to complete the experience and serves as an optional support resource. Vocabulary Words: These vocabulary words are used in the experience or connect closely to the standards and content students examine. Students should understand these terms as they work through the experience. Objectives
The United States has one of the largest populations in the world. It ranks third, after India and China. However, people are not spread evenly across the country. Population density measures the average number of people living in a certain amount of land. Some parts of the United States have very high population density, while others have far fewer people.
In this lesson, you will examine different characteristics of the U.S. population near the end of the twentieth century. You will also learn how different types of population maps can help show where people lived and how the population was changing.
Objectives
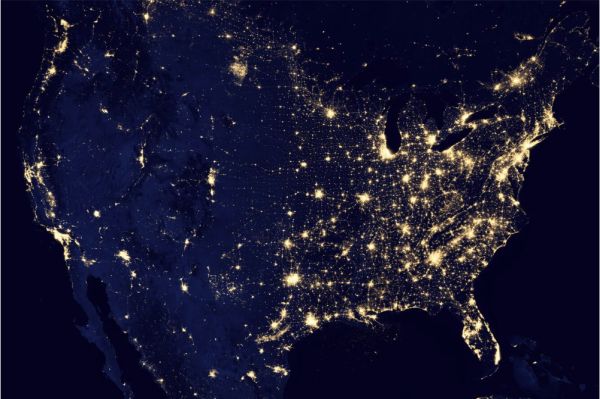
Nighttime Map of the United States
Look at the Nighttime Map of the U.S.
What do you notice about the map? What stands out to you?

Summarize student observations. If not covered in their posts, ask students:
When everyone is ready to continue, unlock the next scene.


